Category Archives: PAPA2

Ornaments on a Tree

Inspired by this post  from Sarah Carter and this post  from Kim Hughey, we played Ornaments on a Tree to review for our rational expressions exam.

Setup

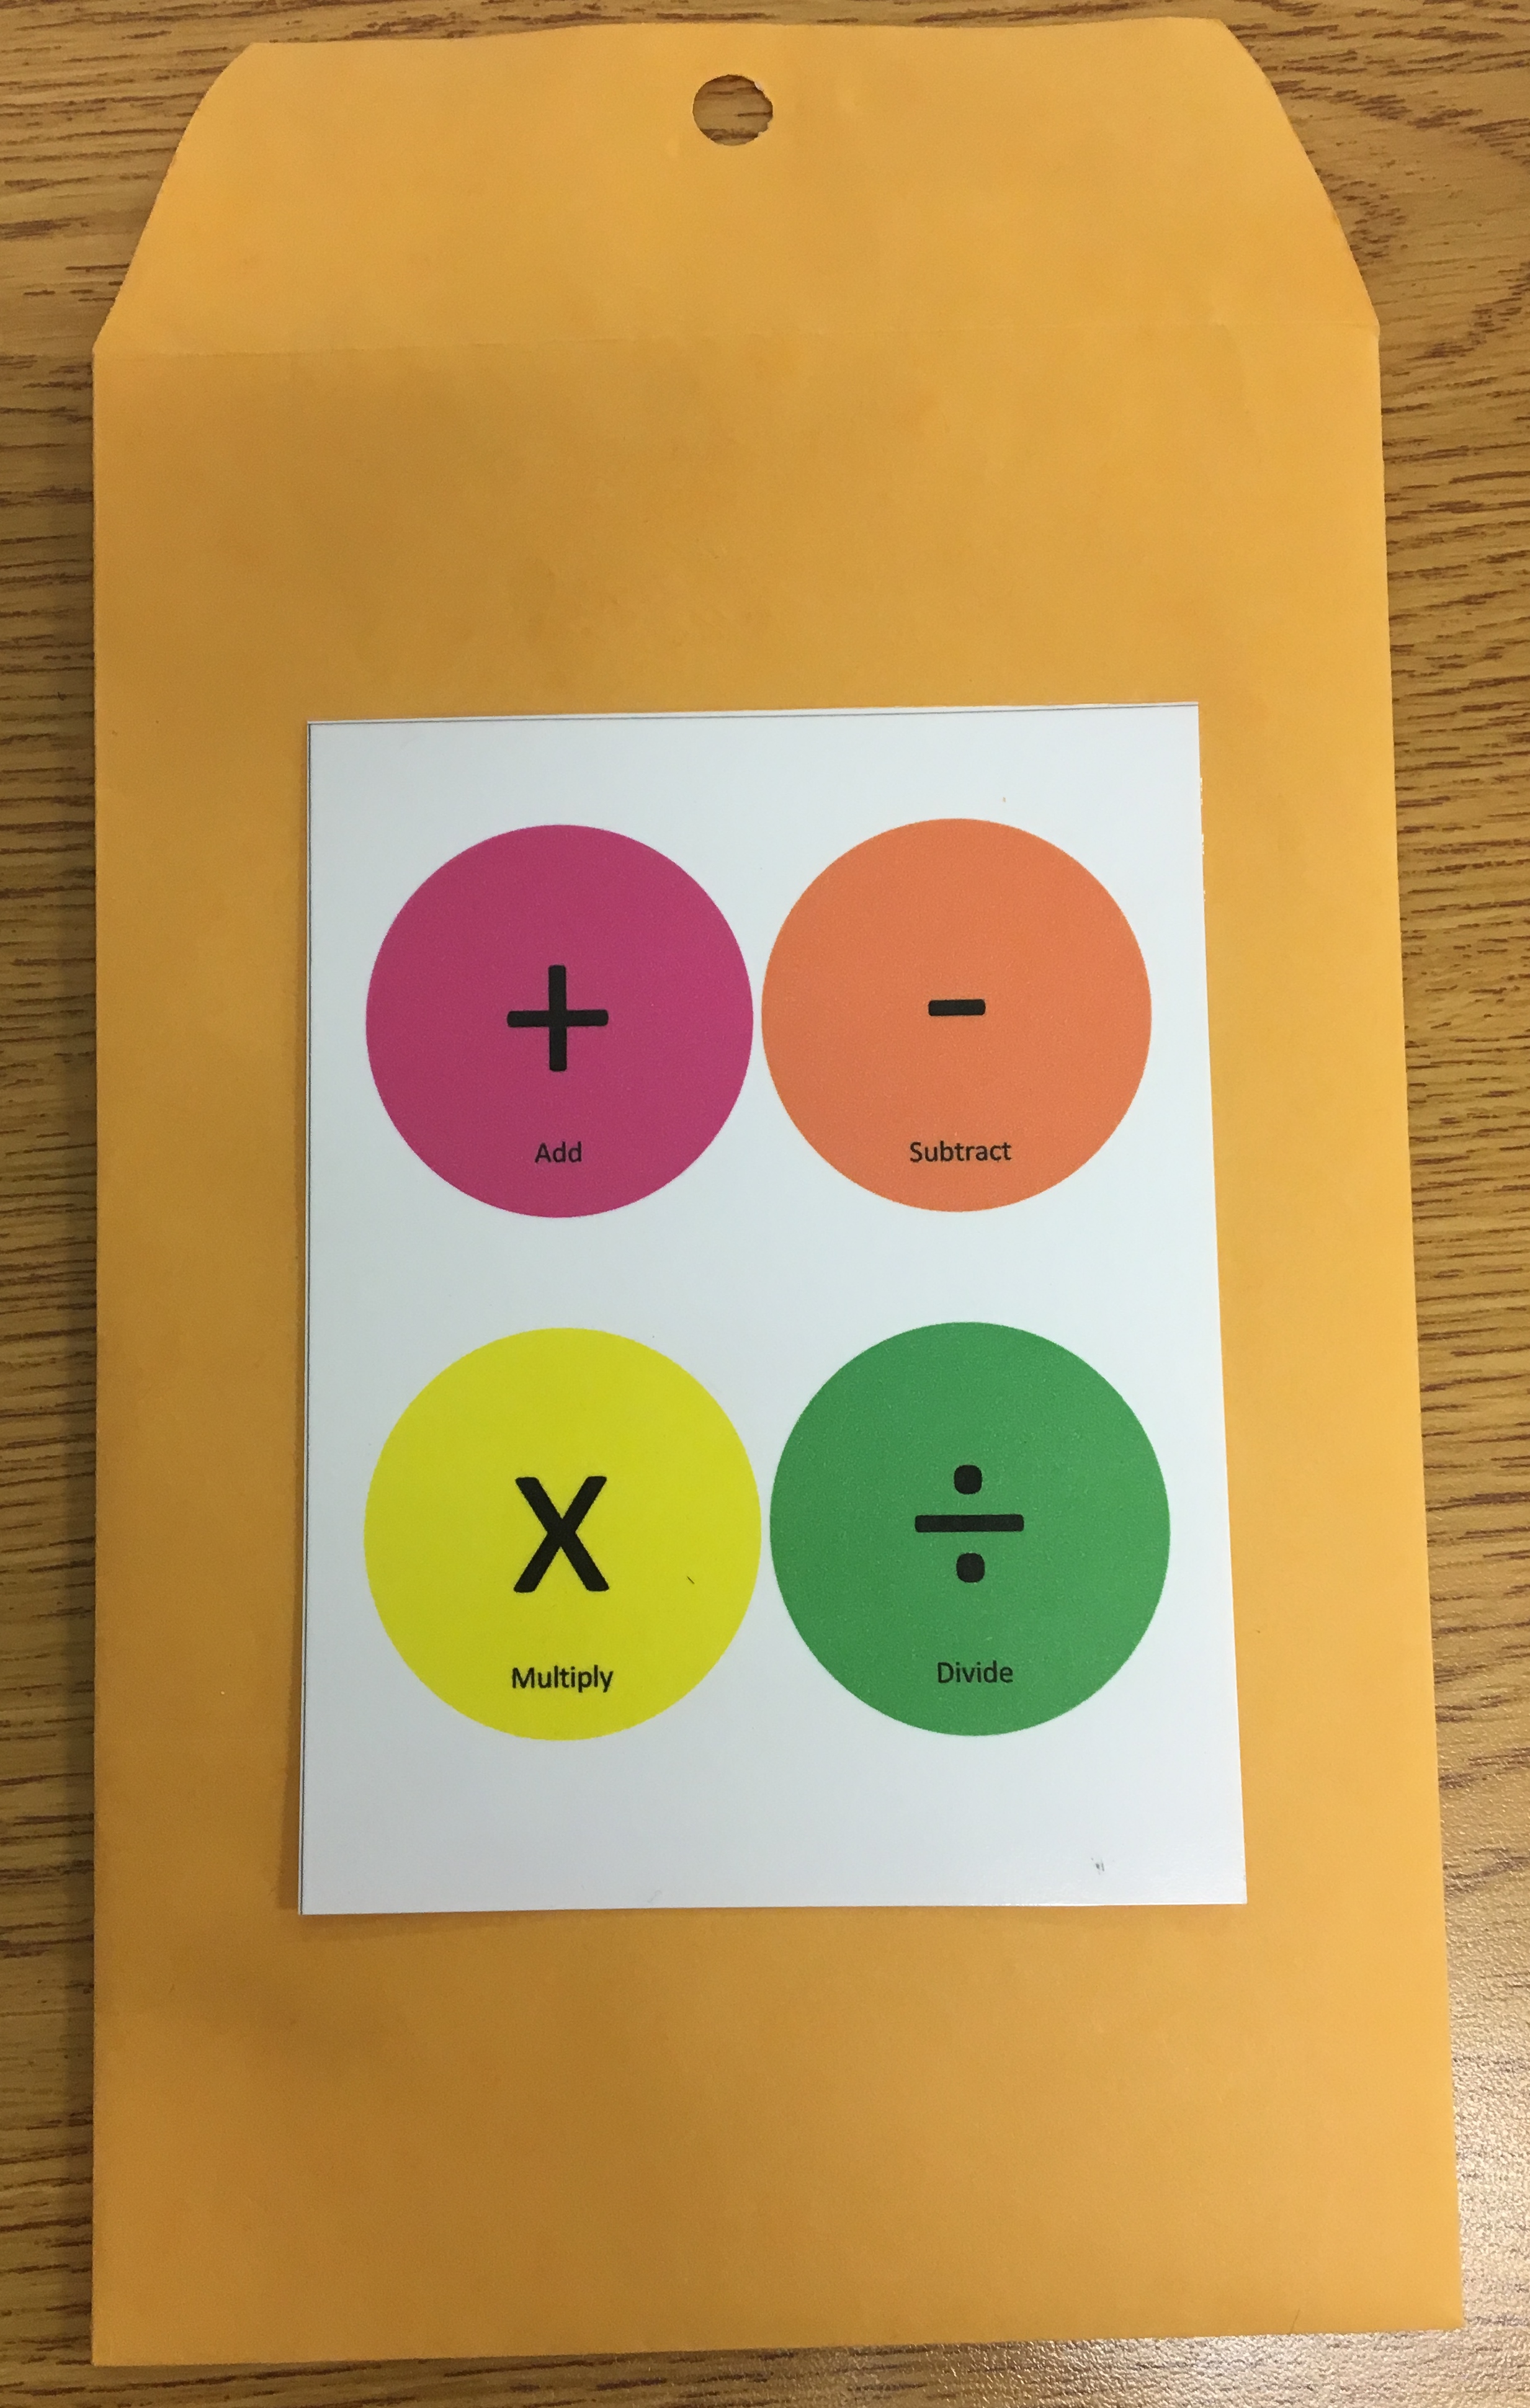
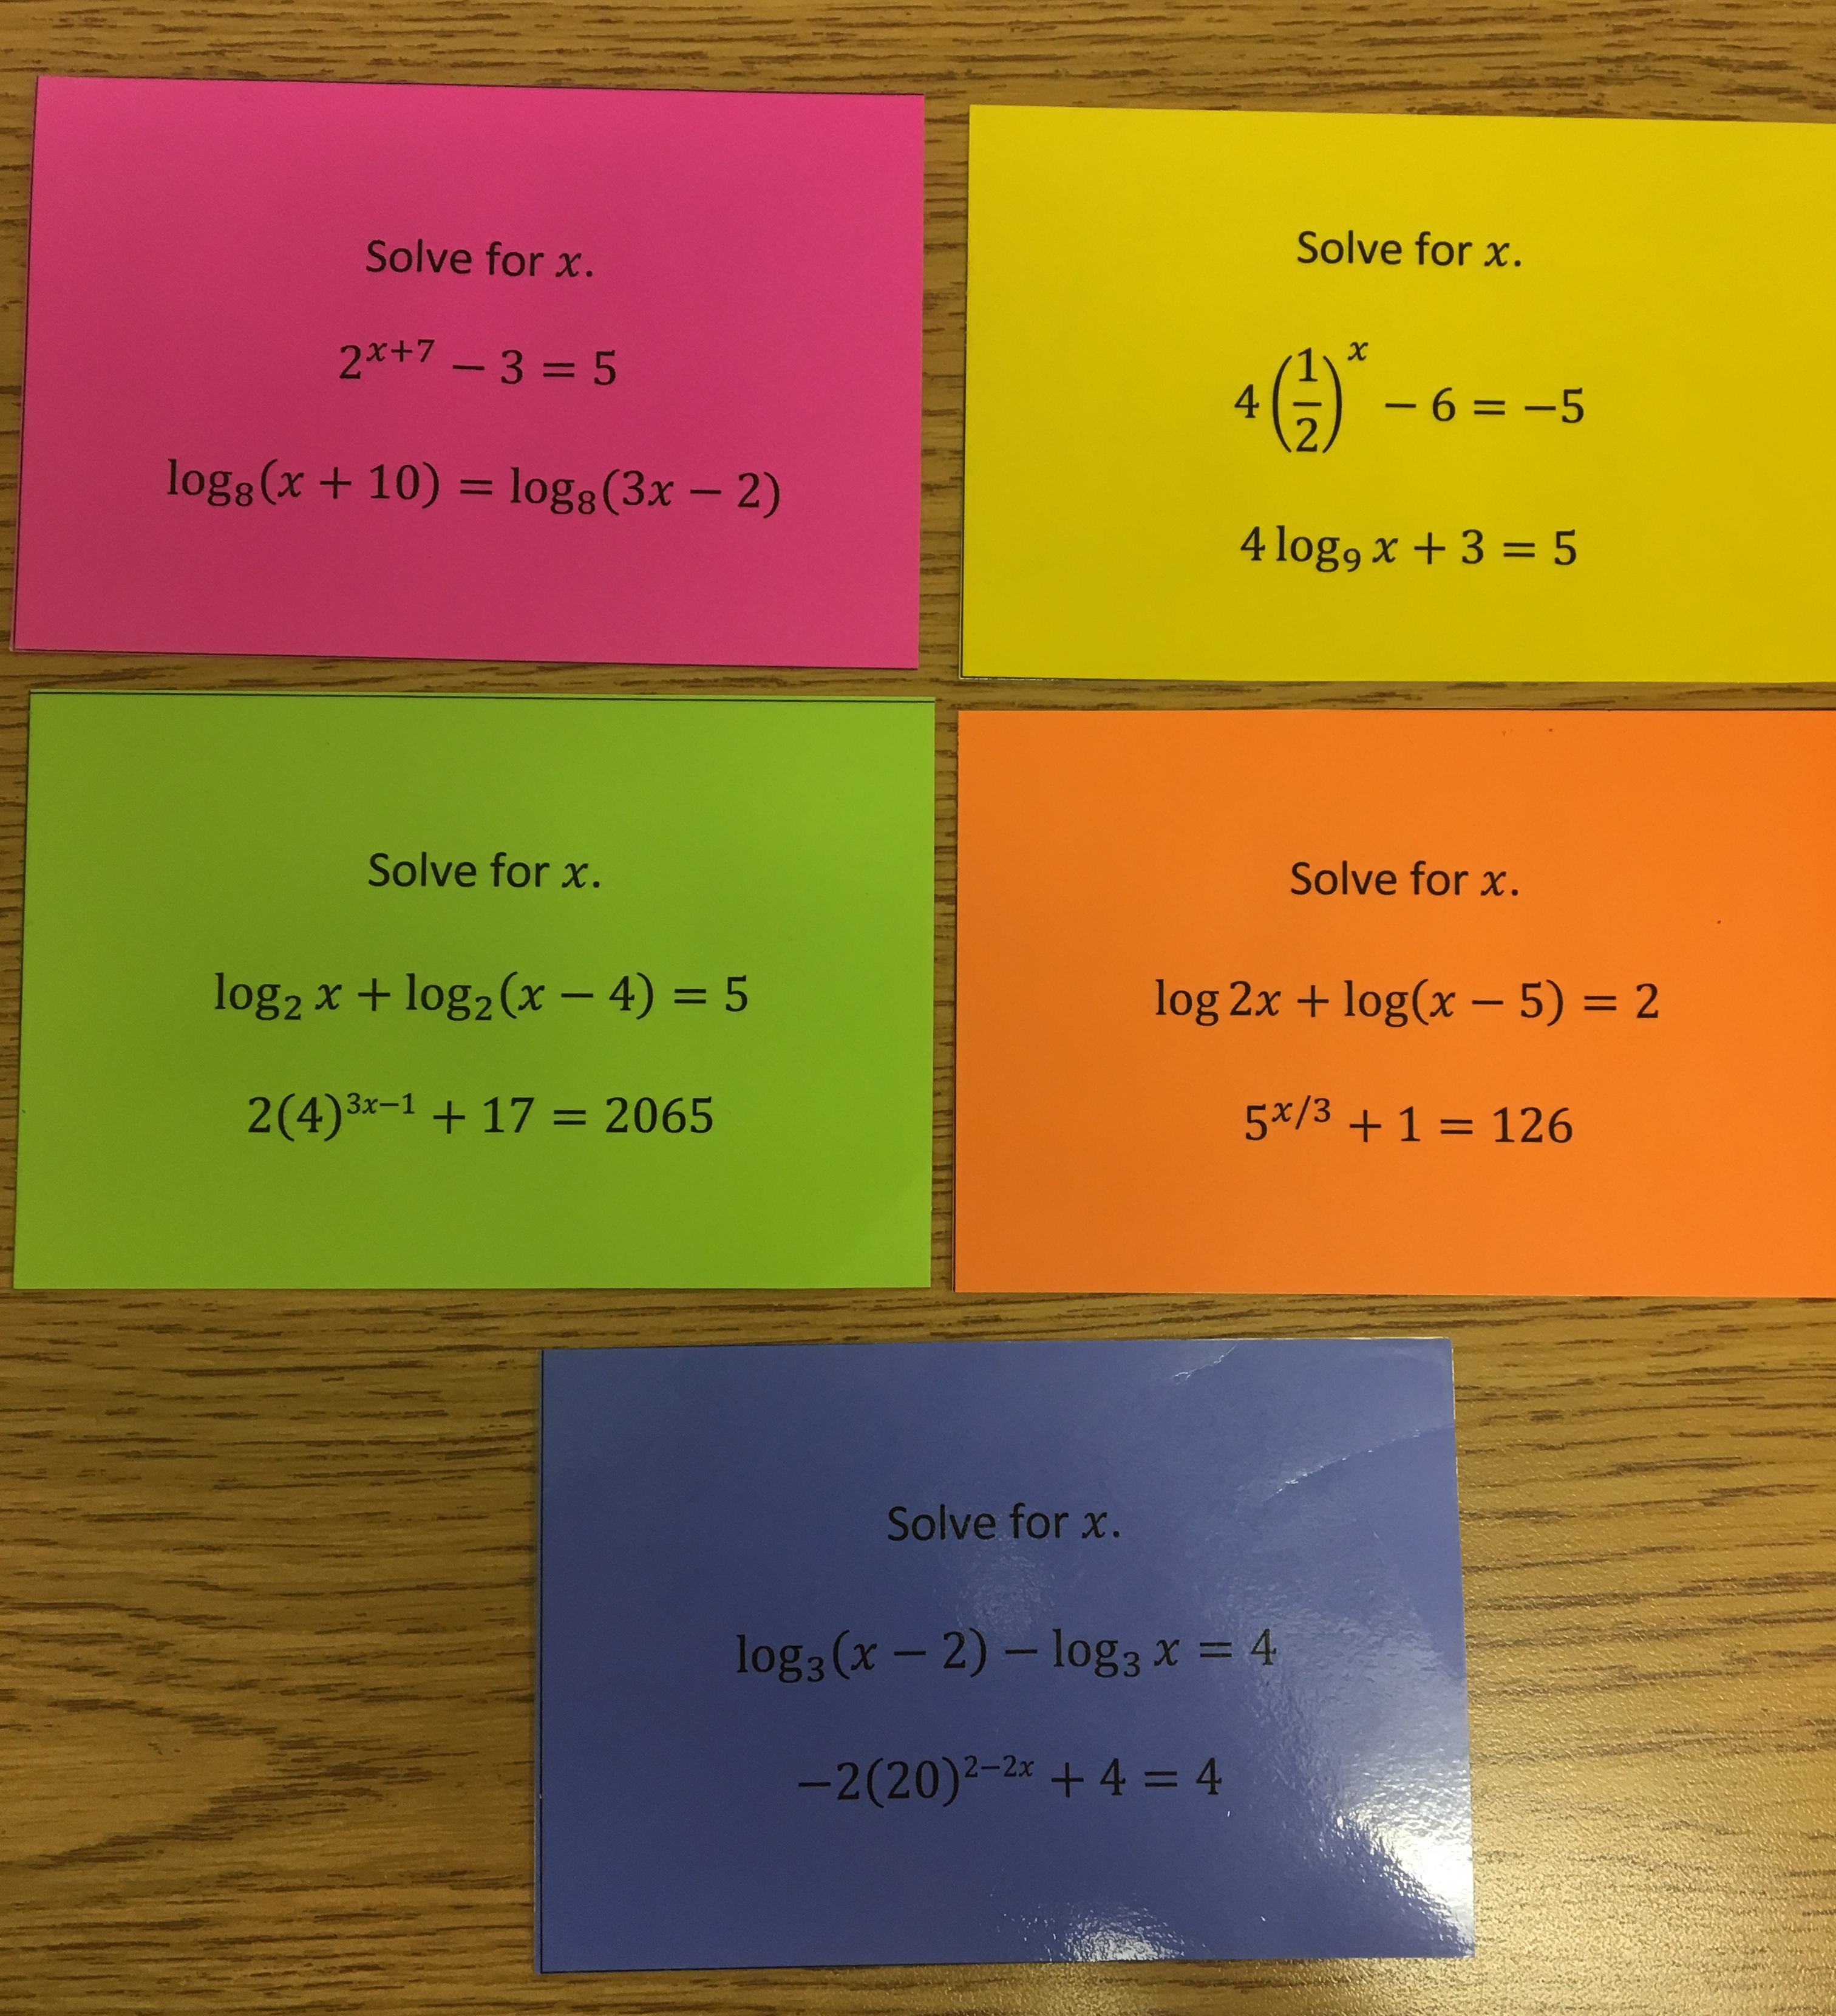
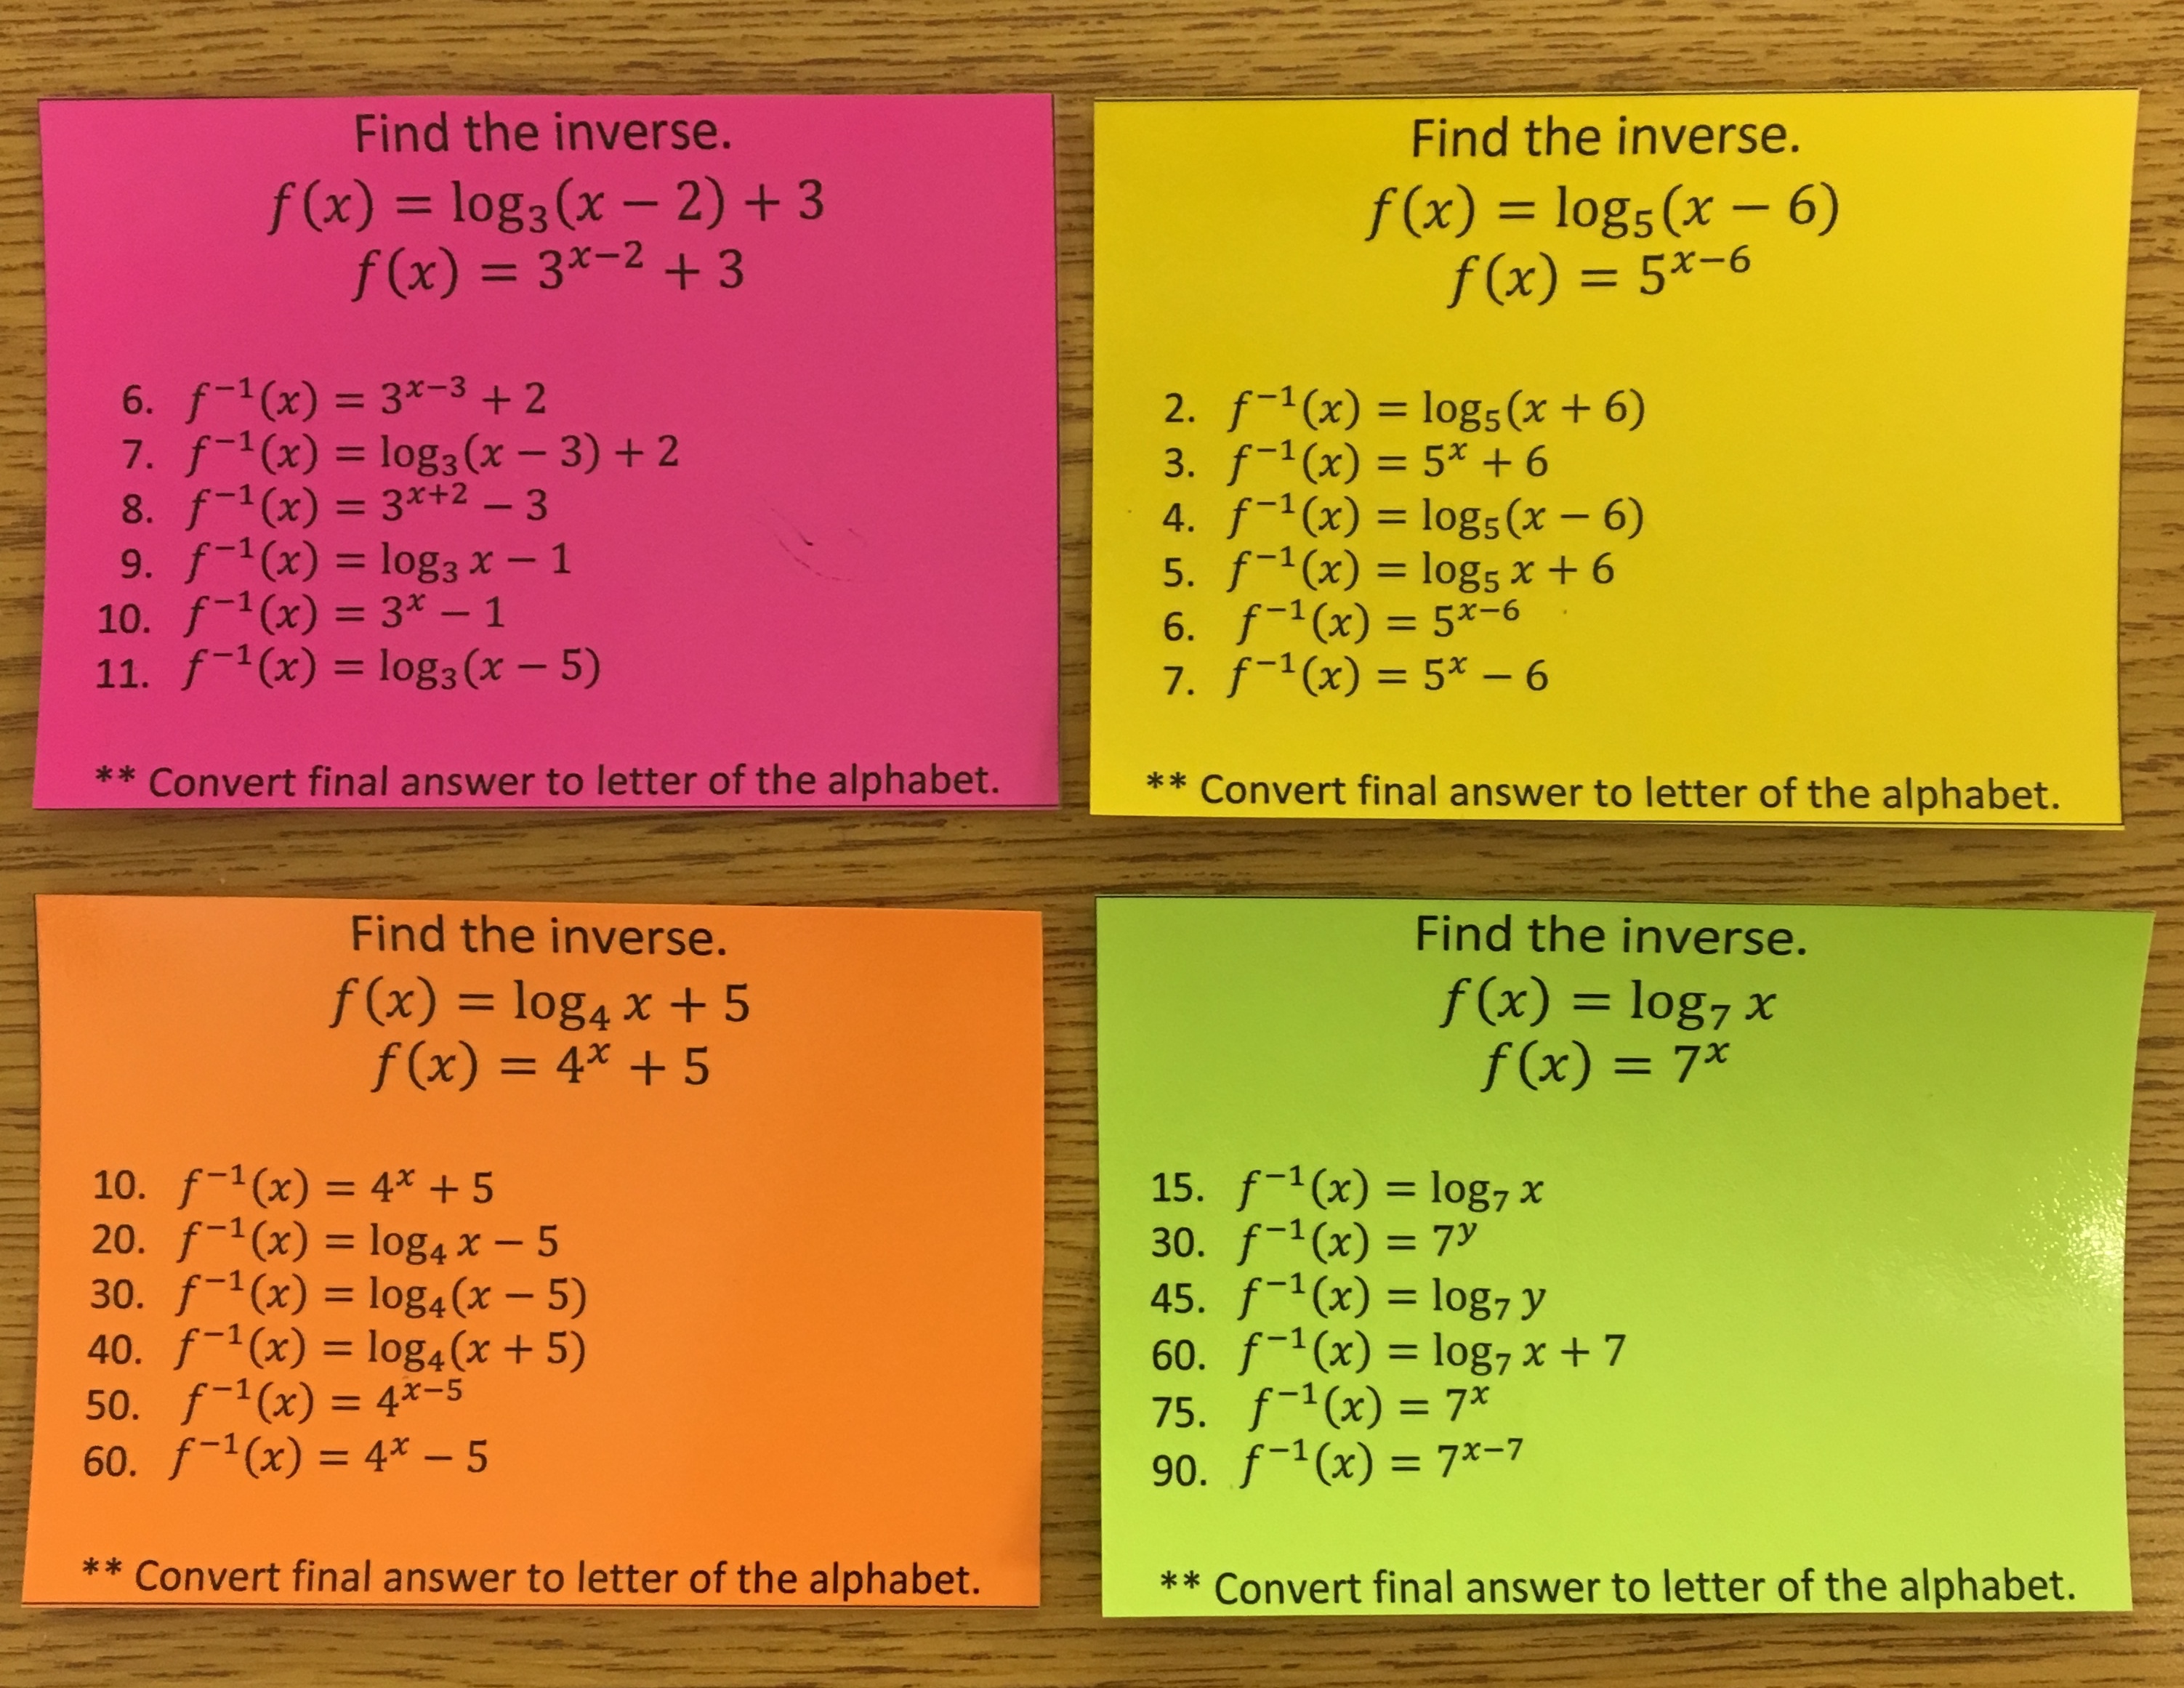
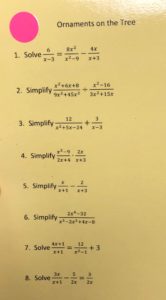
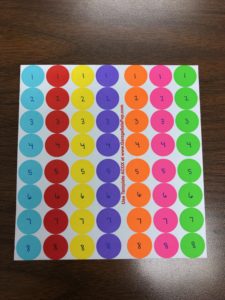
I made two sets of trees (four trees per set).  I put a point value on the back of each tree.  I used 0 points, 2 points, 5 points, and -1 point.  I also printed eight sets of problems (one per group) and put a colored sticker in the upper left corner.  Then I laminated the trees and problems.

For each group, I wrote the numbers 1 – 8 on the colored stickers that would correspond to the group’s colored sticker.

Before class, I randomly taped a set of trees to the whiteboard.  I put my desks in groups of four and gave each group four dry-erase boards and markers, an eraser, and the set of problems.

Playing the Game

Each person in the group must work the same problem.  When every member of the group had all their work shown and an answer, the group would raise their hand so I could check their work and answer.  If the group’s work and answers were correct, the group received a sticker.  The color of the sticker matched the color of the sticker on their set of problems, and the number on the sticker indicated the problem they had correctly simplified or solved.  One member of the group would then place the sticker on any one of the trees (not knowing what the point values were for the trees).  Groups could work the problems in any order.  Since I had numbered the stickers, I was able to keep track of which problems each group had already worked.

About 5 minutes before the end of the class, we stopped playing so that the points could be tallied.

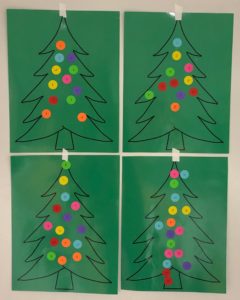
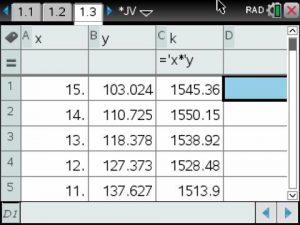
Each sticker on the tree for each group was multiplied by the number of points on the back of the tree.  The group with the highest point total was the winner and received a star sticker.

Since I had two sets of trees, I was able to run the game with back to back classes.  In between classes, I removed the stickers from the previous class.

Exponential and Logarithmic Equations Breakout

Last year I created a mini breakout on solving exponential and logarithmic equations.  This year, the other Pre-AP Algebra 2 teacher at my school decided added to the breakout to include finding inverses of exponential and logarithmic equations.

Story

Pearland High School – population 2985 – has been infiltrated by zombies.

It started with one zombie.  In ten minutes, there were 25 zombies.  After 15 minutes, there were 625 zombies.  If this rate continues, the entire student body will be zombies in 30 minutes.

But YOU can stop the zombie attack.  The antidote is locked in this box!  You have 30 minutes to decipher the codes and retrieve the antidote.  It’s as simple as moving left, down, up, right!  Can you break out in time to stop the zombies from taking over Pearland High School?

Setup

I placed all three locks (directional, 4-digit, and 4-letter lock) on a hasp attached to one box.  I projected and read the story to the class and asked each group to get an envelope with the clues from me.

Envelope with Color Clue

4-Digit Lock Clues

Solving Equations Clues

4-Letter Lock Clues

Inverses Clues

Several of the groups placed the envelope on an empty desk or up-side-down, so they did not notice the color clue that told them what to do with the solutions to the solving equations clues and inverses clues.  As a hint for groups that requested one, I indicated that they needed to pay attention to the paper on the front of the envelope.

The other teacher placed each lock on a separate box.  She gave each group the story and the color clue that would be used with the other two sets of clues.  The students had to open the directional lock to get the clues for the 4-digit lock.  Then they had to open the 4-digit lock to get the clues for the 4-letter lock.

Groups had 30 minutes to solve the clues to breakout and not become a Zombie.

Zombies

In my classes, 13 out of 22 groups became “Zombies.”  However, with an additional 15 minutes, only 2 group were unable to successfully breakout.

In the other teachers classes, 1 group became “Zombies.”

I believe the reason my students were less “successful” was because they did not know what to do with all the clues.  Each group “divided and conquered” to solve the exponential and logarithmic equations and find the inverses, but they did not understand which cards went with each lock.  I watched multiple groups switch cards with their teammates to have them check their work, so they had the right answers.

In the other teacher’s class, the students were presented with one set of clues at a time.  Once they had figured out what to do for the 4-digit lock, they were able to transfer that knowledge to decode the clues for the 4-letter lock.

Files


Advice from Students for Students

My students were asked to write a letter to the students that would be taking PAP Algebra 2 next year giving them advice.  Here is their advice to next year’s students.

So you’re taking PAP Algebra 2.  Whatever ideas you have about this course – go ahead and banish them from your mind.  PAP Algebra 2 is not some evil class that will suck the life out of you.  Sure, it’s challenging – but you can handle it.  You didn’t take this course to be babied. You took it because advanced classes look good on your transcript and because, to some degree, you believe you have what it takes to at least pass.  In PAP Algebra 2, you can expect to have lots of homework (sorry, but that’s just how it is).  You can also expect to be working from bell to bell, so don’t try to pull out your other homeworks.  Look.  My advice to you is: do all that you can.  This class was made to test you.  To see if you can handle varying levels of difficulty.  Just try your hardest and you’ll make it.  Also: don’t use scratchpad. – Abby


Regarding IDs

  • Don’t fight the ID.  She will make your wear them.

Regarding Notes

  • First, you are going to want a big notebook, so you can write all your notes down.  And second you want to have good notes, so you can go back on them and study.
  • Print out your notes.  It will save you time and will help you focus and understand the lesson better.
  • I’d consider printing out your notes if you’re doing any kind of graphing because the graph Ms. Kelly is giving you is better than your sketch; I promise.
  • Printing your notes off of Canvas allows you to understand what you are answering. (And not to mention, it minimizes hand cramps because you don’t have to write as much or as fast.)
  • If you think you can come into this class and not take notes, or do your homework, and expect to do good on all the tests and quizzes, you’re wrong.

Regarding Homework and Canvas

  • Expect homework most nights and be ready for quizzes because there are a lot of them.
  • You should always do your homework the night you get it, even though it may not be due the next day.  Also, don’t check Canvas before or you won’t learn the material and you will fail the weekly quizzes!
  • Always check Canvas to make sure you have done your homework correctly.
  • When you work, you are expected to make mistakes, but learn from them.
  • Show ALL of your work!!!
  • If you want to do well, properly do your homework.  Don’t simply copy answers or you’ll likely fail the quizzes.
  • Check Canvas for assignments if you were absent.  Ms. Kelly will say the same thing.
  • Canvas will help you in the long run.  Everything you need on there is important like notes, assignments, and there is discussion board so if you need help with your work.
  • If you haven’t experienced the magical greatness that is the TI-Nspire CX calculator, get ready for a thrill ride.  These calculators make completing many complex mathematical equations a breeze and I highly suggest you purchase one for homework uses.

Regarding Asking Question

  • Ask questions.  If you don’t understand something, ask questions.  It’s what teachers are there for.
  • Go to tutoring if you don’t understand.  Ms. Kelly is like the smartest person ever so go to her and she can help if you don’t understand anything.
  • If you don’t understand Ms. Kelly is always there to help and she’s not just going to give you the answer.  She is going to make you think.

General Advice

  • Don’t rush on the test/quiz because you might make the stupidest mistake.
  • Remember the ± sign in front of square roots.
  • Come to class with a positive attitude and an open mind to learn new things.
  • Expect to learn a lot of math and equations that build upon each other because the thing you learned in the 1st term will definitely be used until the end of the year.
  • Don’t use scratchpad.  If you do use scratchpad, Ms. Kelly’s scratchpad senses will kick in and she’ll be at your desk saying “No scratchpad” fast than you can type the first number.
  • Ask Ms. Kelly to tell you π.
  • Don’t let Ms. Kelly make you think she doesn’t laugh.
  • Last but not least, no Ms. Kelly can’t follow you to pre-cal (I already asked).


Data Collection – Boyle’s Law

Yesterday, as part of my Innovative Teaching Grant from the Pearland ISD Education Foundation, my students completed a data collection lab.

Objective

  • Model pressure versus volume using inverse variation

Procedure

Boyles Law Data Lab

Although students were in groups of three to four, each student collected their own data. Members of the group rotated between three jobs: syringe, calculator, directions.

A syringe containing 15 mL of air was screwed onto the gas pressure sensor, which was connected to the TI-Nspire.  The pressure of the air was recorded using the Data Quest App on the TI-Nspire.

Gas Pressure Sensor with Syringe

The gas was compressed to 14 mL, and the pressure was recorded.

Compressing the Air in the Syringe

The pressure reading was also recorded for 13 mL, 12 mL, 11 mL, and 10 mL.

Analysis

An example of one student’s data collection.

Pressure vs Volume Graph

Students noted that as the volume increased the pressure decreased.

The constant of variation was calculated by multiplying pressure and volume.  Then the average  was calculated.

Data Table

Using the mean value for the constant of variation, a model was written and graphed on the scatterplot of the data.

Inverse Variation Model

Results

Students used their models to predict the pressure for a volume of 20 mL and 5 mL.  Based on their predictions, they were able to determine that when the volume of a gas is decreased from 40 mL to 10 mL, the pressure will quadruple.

BreakoutEDU

About a month ago, I saw a tweet on Twitter referring to BreakoutEDU.  I opened the link to the blog post and was instantly intrigued.  The BreakoutEDU website was blocked by our school, so I had to use my cell phone to look at the site.  If you don’t sign up to be a beta tester, there isn’t much to see on the website other than an intro video and the supplies you would need to create your own breakout, if you don’t want to purchase their kit.  I signed up so that I could get the password to the games.  As soon as I had the chance, I went to my AP to share my enthusiasm with him regarding this new thing that I was going to try.

Boxes

Unlike the BreakoutEDU kit, I really wanted multiple boxes so that instead of having all clues out in the open, students would have to open a box to get a clue to another box, ultimately opening all the boxes and breaking out.  I also knew that I wanted the boxes to nest for easy storage.  I knew that I could get my dad to make these boxes for me.

I let my dad in on my idea, and he delivered.

One box  Nesting boxes  Stacked boxes

I now have four sets of breakout boxes, each with five nesting boxes.

Building Anticipation

I brought two set of boxes up to school one weekend and set them at the front of the room.  Then I started leaving messages in small print on the board.  I put up things like

  • Have you ever been to an escape room?
  • My stickers are missing.
  • I need a UV flashlight.
  • May 24

A few of the classes paid attention to these little notes and asked about them.

Some days I would change the lock that was on the outside of the box, or put the large hasp on the box with all the locks.

About a week before we were schedule to go play our game, I un-nested the two sets of boxes that were in my room.  The Saturday before we were schedule to go play our game, I brought up one more set of boxes.  Now I really had their attention.  Where were all these boxes coming from?

Games

Since it is the end of the school year, I decided to create my own game for our first breakout.  I made a game that would review concepts for the spring semester exam.  The topics included transformations of parent functions, simplifying expressions (exponent rules and radicals), solving equations (radical and logarithmic), and rationals (properties of their graph, simplifying, and solving).  Students were given 45 minutes and two hint cards.

Review breakout

We went to the lecture hall to play our first game on May 24.  The classes were divided into three groups each.  I started the timer, and let them go.  Every group used one of their hint cards to get them started.


After they had the first box open, there was no stopping them.


Every group, in every period, broke out!  Unfortunately, I didn’t get a video of any group opening their last box, but we did take pictures once they had opened their last box.  They also got a sticker for their success.  Believe it or not, high school students will do anything for a sticker.


The following day we did another breakout.  This time I used Dr. Johnson’s Lab from the BreakoutEDU website.  The setup only uses two boxes.  The big box has a hasp on it that can hold up to six locks.

Johnson setup

I only have two hasp, so we did boys versus girls.  I have mostly girls in all my classes, except for 5th period, which is pretty close to 50/50.  However, more heads did not lead to the girls breaking out faster than the boys.  Except for first period, the boys broke out before the girls.


Feedback from the students was that they really enjoyed the breakouts.

Data Collection – Exponential Part 2

Objectives

  • Record the successive maximum heights for a bouncing ball.
  • Model the bounce height data with an exponential function.

Procedure

Bounce Back

Groups of three students used a motion detector to collect the height of a bouncing ball for 5 seconds.

Ready to Bounce

Ready to Bounce

Bouncing Ball

Bouncing Ball

Analysis

An example of one group’s data collection.

Bounce Height Data Quest

Height vs Time Graph

Students determined the maximum height of five successive bounces.  They put the data in a List & Spreadsheets Page.

Bounce Height Data 1 Bounce Height Data 2

The data for the first and fourth bounce was used to mathematically determine an exponential model that would fit the data.  They plotted their data and model on a Data & Statistics Page.

Bounce Back Exponential

Calculated Model

Then they had the calculator find the exponential regression for their data.

Bounce Back Regression

Exponential Regression

Results

Most groups found their model and the exponential regression to be very similar.

Data Collection – Exponential

Today, as part of my Innovative Teaching Grant from the Pearland ISD Education Foundation, my students completed their third data collection lab.

Objectives

  • Record temperature versus time for a cooling object.
  • Model the temperature of an object as it cools.

Procedure

How Cool It Is

I had a crock pot of hot water.  Each group of three students were given a cup of the hot water.  They placed the temperature probe in the hot water for about 30 seconds, then removed the temperature probe and allowed it to cool.  The calculator collected the temperature data for three minutes.

probe in water

Temperature Probe in Hot Water

probe cooling

Temperature Probe Cooling

Analysis

An example of one group’s data collection.

Temp DataQuest before exp fit

Temperature vs Time Graph

Students determined that an exponential model should fit the data.  They had the calculator graph the exponential regression for their data.

Temp DataQuest

Temperature vs Time Graph with Exponential Regression

The exponential model did not appear to be a very good fit.  They determine that the exponential model should have an asymptote at room temperature.  So they adjusted the collected temperature values by subtracting the room temperature.  Then they sent the data to a Data & Statistics page for further analysis.

The data for 20 seconds and 160 seconds was used to mathematically determine an exponential model that would fit their adjusted temperature data.  They plotted their model, then compared their model to the exponential regression using the adjusted temperature data.

Temp with Plotted Function

Calculated Model

Temp with Regression

Exponential Regression

Results

Most groups found their model and the exponential regression to be very similar.

Data Collection – Inverse Variation

Objectives

  • Model pressure versus volume using inverse variation

Procedure

I had some extra time after reviewing for a test in one of my classes, so I got out the gas pressure sensor for us to model pressure versus volume. We had studied direct and inverse variation.

Since I only have two gas pressure sensors, we did this as a class demonstration using the TI-Navigator Live Presenter and one of the gas pressure sensors. One student had the calculator to capture the data and another student had the sensor with the syringe of air.

Most of my students are sophomores and are currently in Chemistry. They have not studied the gas laws, yet.  Before we started capturing the data, I had the student with the sensor increase and decrease the volume of air in the syringe. We looked at what was happening to the pressure and predicted that inverse variation would model the data.

Analysis

Pressure vs Volume Graph

Pressure vs Volume Graph

Pressure vs Volume Table

Pressure vs Volume Table

We looked at the table and saw that as the pressure increased, the volume decreased. We calculated the constant of variation by multiplying pressure and volume.

k Column

Constant of Variation Calculated Column

The constant of variation was relatively constant. The average was 20.4.

We plotted the inverse variation equation Inverse Variation Equation on our graph.

Pressure vs Volume Model

Inverse Variation Model

Factor, Crumple, Toss

Inspired by this post from Kate Nowak, today, we played Factor, Crumple, Toss.

I made a record sheet for each student.  The only thing they were to write on this paper was their name.  I also pre-cut several small sheets of paper for students to work the problems.  I explained the directions and answered any questions the students had.

Factor, Crumple, Toss Directions

Then I projected these problems.

Factor, Crumple, Toss Problems

Originally I had moved all the desks to the perimeter of the room and had the extra point tossing area in the middle of the room.  After 1st period, I made some changes to the room arrangement.  I moved the extra point tossing area so that is was next to a wall.  I did not want students walking through the tossing area while another student was trying to earn extra points.  I also put some tape on the floor where students were to form a line to have their answers checked.

Factor Crumple Toss

I loved the student’s engagement.  Not only were they working the problems, but they were encouraging each other as they attempted to get extra points.  Although some students became frustrated when they did not get the correct answer to a problem multiple times, I think the activity was much better than having the students sit at their desks and complete a worksheet.