Objectives
- Model pressure versus volume using inverse variation
Procedure
I had some extra time after reviewing for a test in one of my classes, so I got out the gas pressure sensor for us to model pressure versus volume. We had studied direct and inverse variation.
Since I only have two gas pressure sensors, we did this as a class demonstration using the TI-Navigator Live Presenter and one of the gas pressure sensors. One student had the calculator to capture the data and another student had the sensor with the syringe of air.
Most of my students are sophomores and are currently in Chemistry. They have not studied the gas laws, yet. Before we started capturing the data, I had the student with the sensor increase and decrease the volume of air in the syringe. We looked at what was happening to the pressure and predicted that inverse variation would model the data.
Analysis
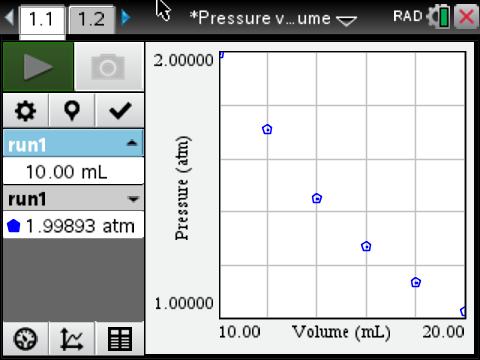
Pressure vs Volume Graph
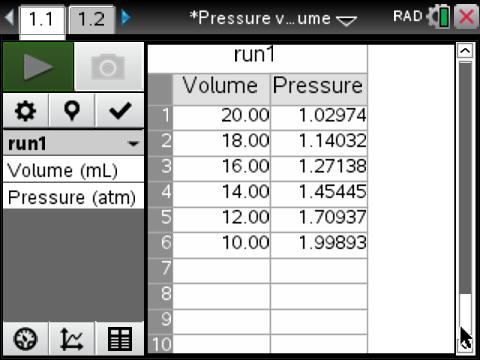
Pressure vs Volume Table
We looked at the table and saw that as the pressure increased, the volume decreased. We calculated the constant of variation by multiplying pressure and volume.
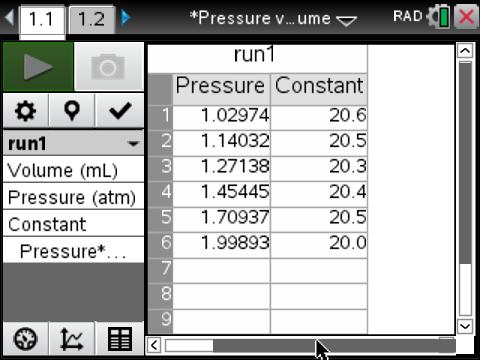
Constant of Variation Calculated Column
The constant of variation was relatively constant. The average was 20.4.
We plotted the inverse variation equation ![]() on our graph.
on our graph.
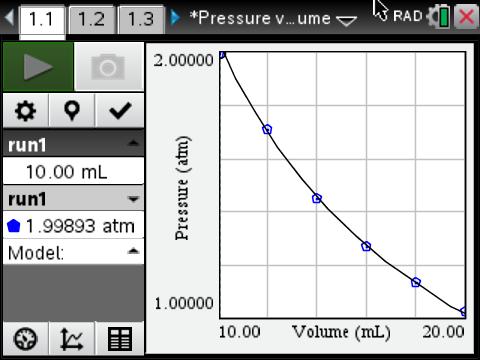
Inverse Variation Model