Update the OS on the Handheld
- Download the latest OS for you TI-Nspire handhelds from TI-Nspire™ Technology | Software Updates | Texas Instruments
- Connect the handhelds to your computer via the docking station or with navigator hats.
- In the TI-Npsire CX Premium Teacher Software, go to Tools >Transfer Tool >Add to Transfer List. Select your OS and start the transfer.
- After the handhelds have restarted, choose your language and font size on each handheld.
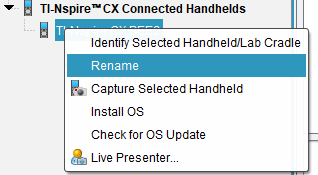
Rename your Handhelds in the Premium Teacher Software
- With the Content Tab selected and the handhelds in the docking station, right click on the name of a handheld and select Rename.
- Look for two green flashing lights on the docking station. This will indicate the selected handheld.
- Give the handheld a new name based on its position in the docking station.
Example: Calculator 07. - Lift the renamed handheld from the docking station so the lights stop blinking.
- Repeat this process until all handhelds have been renamed. Then place all the handhelds back into the docking station for charging.
This makes it easy to quickly identify any handhelds that are not connected to the network. By selecting Connected Handhelds in the Content Tab, you can sort your handhelds by name.
Upload your Classes into the Premium Teacher Software
- Create one CSV file for all your classes with the following columns:
- Class Name
Example: 1st, 2nd, 3rd, etc - First Name
- Last Name
- Student ID
- Class Name
- With the Class Tab selected go to Class >Add Classes >Upload a CVS file >Next >Browse to select your file >Next.
- Map the fields and click Next.

- You will see a message that your class(es) and student profiles have been successfully created. Click OK.
In this example, students will use their student ID as both their username and password to login.
Add a Teacher Icon to your Classes
- Go to File >Settings >Teacher Preferences

- Give yourself a Username and Password and select Add teacher to classroom view.
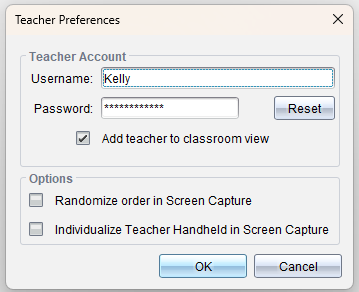
This is helpful if you want to be a Live Presenter.
Texas Teachers: Press-to-Test for STAAR
Handhelds are required to be in Press-to-Test for the administration of the STAAR test. The following instructions are current as of May 2024.
The directions below will:
- Disable CAS
- Limit geometry functions
- Disable implicit graphing, conic templates, conic analysis and geometric conics
- Disable inequality graphing
- Disable Polynomial Root Finder and Simultaneous Equation Solver
Check the TEA STAAR Calculator Policy for any updates.
- Go to Tools >Prepare Handhelds >Send Press-to-Test >Enter Test Code…

- Enter the Test Code 0000-9486 and click Next.