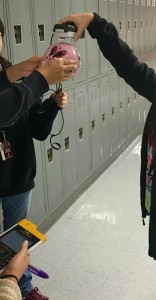
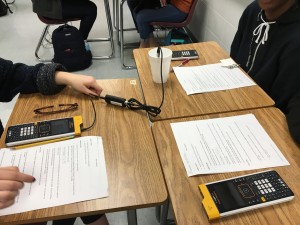
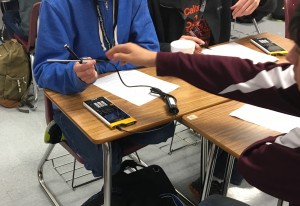
On Wednesday, as part of my Innovative Teaching Grant from the Pearland ISD Education Foundation, my students and my subject partner’s students completed their first data collection lab.
Objectives
- Model data using a linear equation.
- Interpret the slope and intercept values from a linear model.
Procedure
Case 4 Flipping Coins Instructions
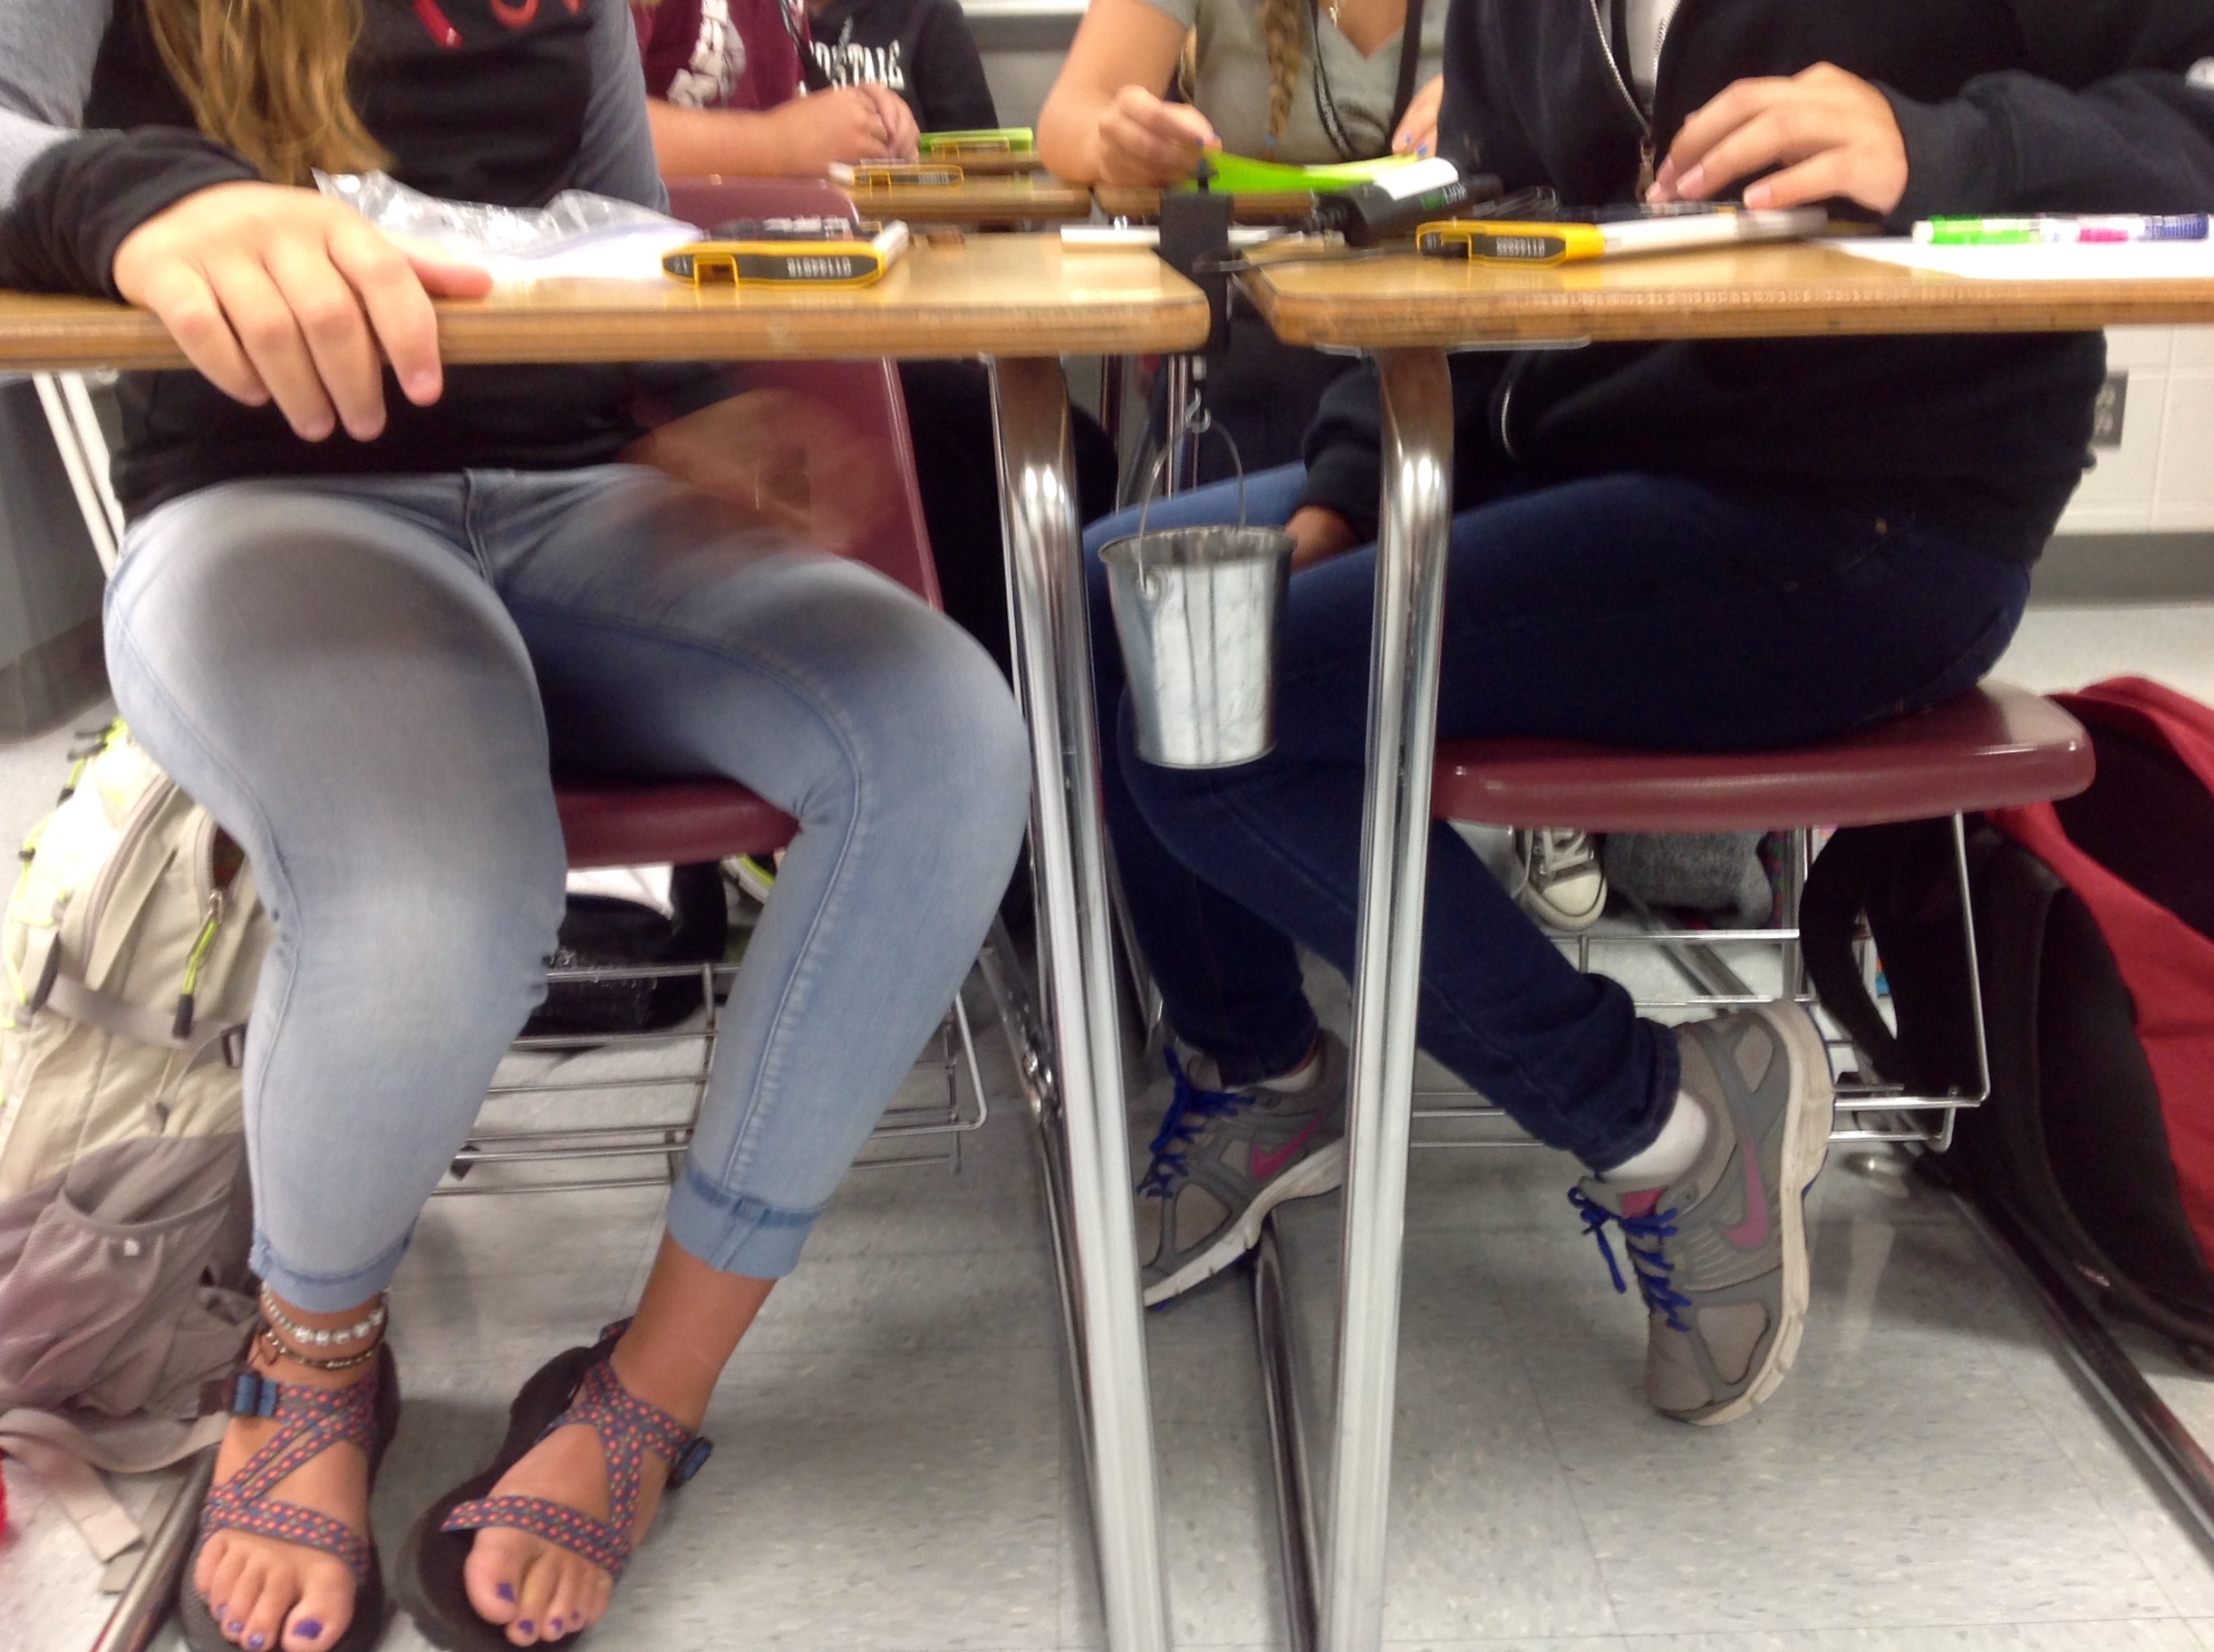
Due to larger than anticipated class sizes, time constraints, and limited 1982 pennies, students worked in groups of three to collect data for one set of pennies (pre-1982, 1982, or post-1982). In a class of 30, four groups collected data for pre-1982 pennies, two groups collected data for 1982 pennies, and four groups collected data for post-1982 pennies. After each group collected their data, the data was shared with the class and compared.

Results
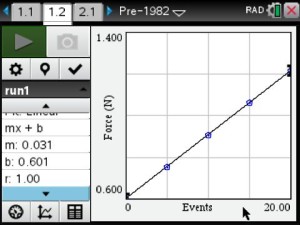
Pre-1982 Pennies
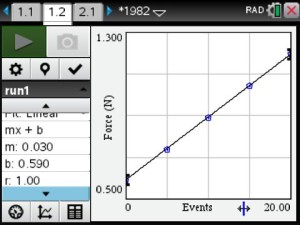
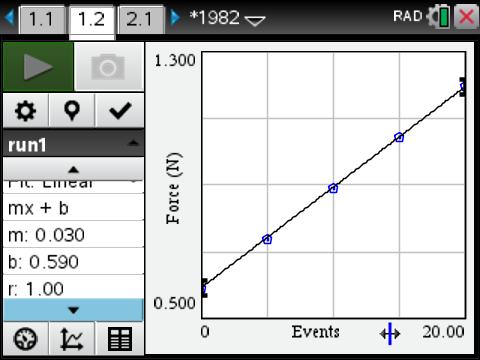
1982 Pennies

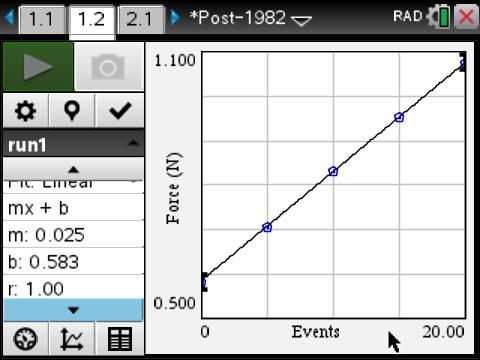
Post-1982 Pennies
Students found that pre-1982 pennies were the most dense and post-1982 pennies were the least dense. Based on their results, they determined that the composition of the penny changed in 1982.
Students interpreted the slope as the “weight” per penny and the y-intercept as the “weight” of the bucket.
For homework, the students completed the Case 4 Flipping Coins Evidence Record.
Case 4 Flipping Coins Evidence Record
Follow-up Questions
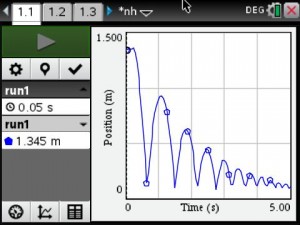
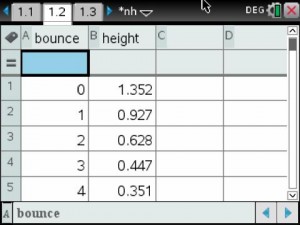
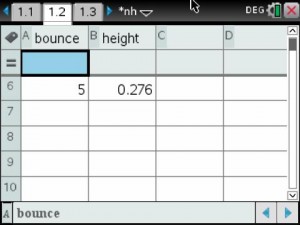
Today, I sent the students some follow-up questions using the TI-Nspire Navigator Quick Polls to assess their understanding.
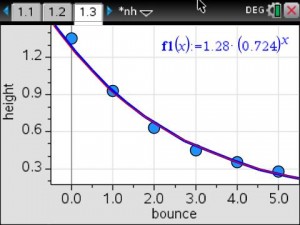
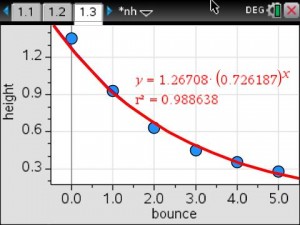
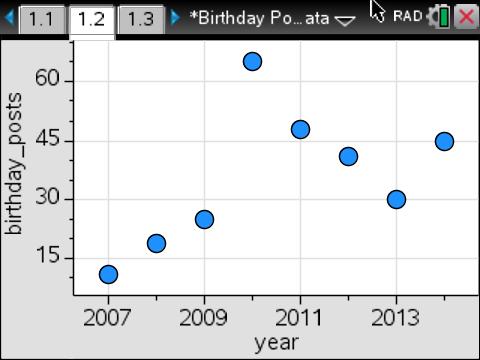
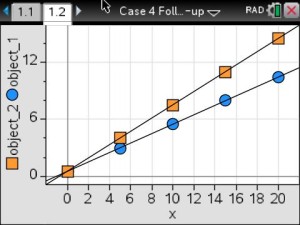
I showed the students the graph below and asked “Which object weighs more?”.
The results from one class period:
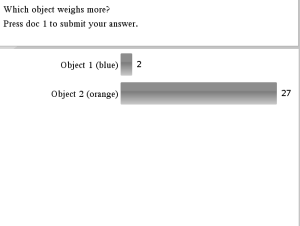
Almost every student correctly identified the correct answer. All other periods had similar results.
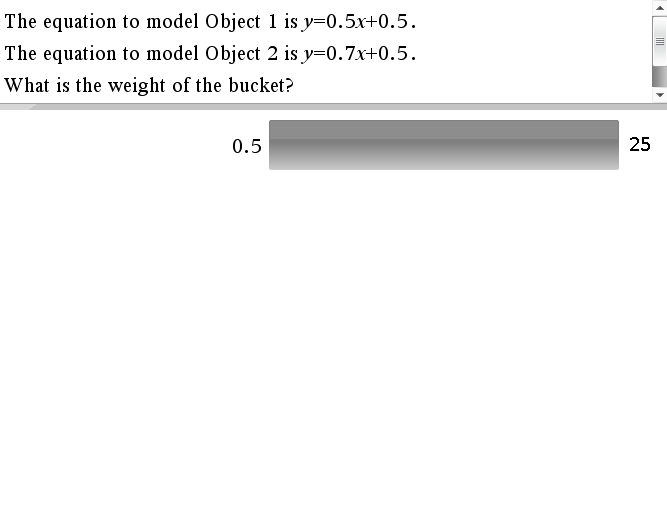
Then I told the students, “The equation to model Object 1 is y = 0.5x + 0.5. The equation to model Object 2 is y = 0.7x + 0.5”. I asked, “What is the weight of the bucket?”.
The results from one class period:
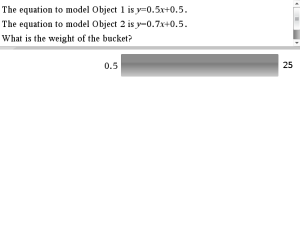
Every student correctly input the correct answer. All other periods had similar results.
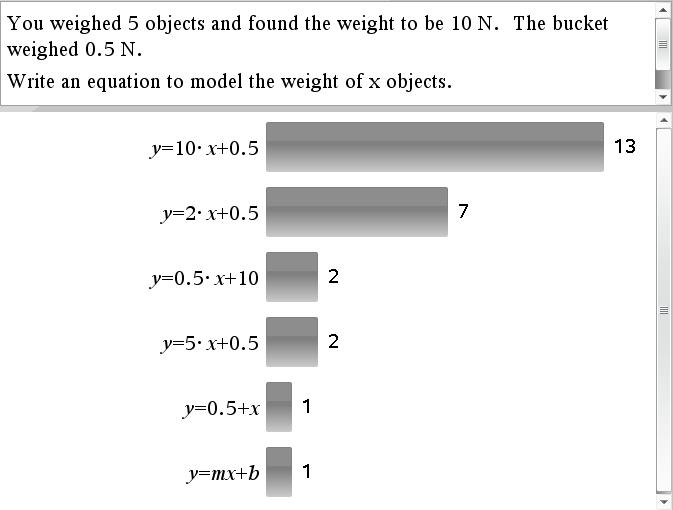
Finally, to truly test their understanding of the meaning of the slope and y-intercept, I told the students, “You weighed 5 objects and found the weight to be 10 N. The bucket weighed 0.5 N.” I asked them to “Write an equation to model the weight of x objects.”.
The results from four class periods:
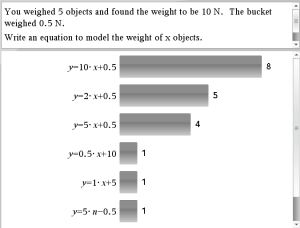

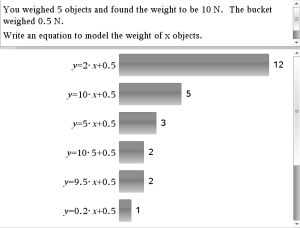
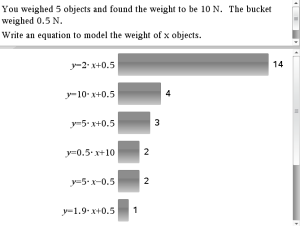
The first two classes needed some reteaching regarding slope. The last two classes did better, but there is still room for improvement. My last class period did not participate in the follow-up questions due to class orientation meetings during their class period.