Author Archives: Jennie Kelly

Physics PD

Three years ago, my district purchased TI-Nspire CX calculators for all 8th grade and algebra 1 teachers.  The following year, they were able to purchase TI-Nspire CX calculators for all geometry teachers.  My campus began purchasing the TI-Nspire calculators a few years before the mass district purchase, but we began with precalculus teachers and worked our way down.  This is the first year that all of the math teachers on my campus have a class set of TI-Nspire CX calculators.  As a result of our transition away from the TI-84+ in the math class, students are coming to science classes with TI-Nspires.  Unfortunately, the science teachers have class sets of TI-83+ or TI-84+ calculators.

I had talked with the math C&I specialist about trying to get the science teachers on board with using the TI-Nspire.  She talked with the science C&I specialist, and we decided to start by providing an overview to the physics teachers.  So this morning I provided the physics teachers in my district with an overview of the TI-Nspire CX.  We only had three hours, so we just scratched the surface with things they can do with the TI-Nspire CX.

I began with a broad overview of the layout of the handheld.  Then I showed them an action-consequence document that I had downloaded from Science Nspired.  Next, we used the CBR2 to practice matching some graphs using the built in DataQuest app.  I purposely planned this activity knowing that the physics teachers have motion detectors and have their students do the graph match activity using the Vernier LabQuest.  Finally, we explored the Science Nspired website.

The biggest concern they had was preventing cheating on test.  I showed them how to put the handheld into Press to Test mode.  Since they do not have class sets of TI-Nspires we decided that it would be best to have students take their calculators to their math teachers in order to get the handheld out of Press to Test mode.

The feedback from the physics teachers was positive.  Although they do not have constant access to TI-Nspires in their classrooms, they walked away feeling more comfortable with helping their students that do have them and allowing those students to use them on tests.

I also learned something from the physics teachers.  In physics, the scales on the axes are often different.  They told me that students are trying to find slope of a line by counting grid lines between points, not recognizing that the horizontal and vertical units of the grid lines are not the same.  I am going to suggest to the math teachers that we begin giving students linear graphs where the axes do not have the same scale and ask the students to find the slope of the line.  Our students will benefit from some graphical literacy.

Transformations Headband Activity

Over the summer I was working on curriculum for a new course, Algebraic Reasoning, that I am teaching a section of this year.  I knew that I wanted to do lots of activities with these students, who typically struggle with math.  I came across an activity that mentioned the game Hedbanz.  Unfortunately, I don’t remember where I saw the activity, so I don’t know who to give credit to.

I have never played the game Hedbanz, but the general gist is that you put a card in a headband and must ask yes/no questions to figure out what is on your card.

I bought some twelve packs of headbands from the dollar store and created cards for function transformations.  My plan was that students would work in pairs.  Student A would tell Student B the parent function and the transformations from the parent function so that Student B could write the equation that was in his/her headband, and vice versa.

After graphing transformations of linear, absolute value, and quadratic functions, I gave a quiz on transformations.  The quizzes were terrible.  I had to rethink how I would use the planned activity.

I made new cards (printed on Avery business cards for convenience).  This time I put the transformations on the back of the card.  So now, Student A would tell Student B the a, b, h, and k parameters for the transformations.  Then Student B would identify the transformations for his/her card, and vice versa.

The activity worked wonderfully.  My inclusion teacher and I were able to spot check pairs of students to make sure that the students were correctly identifying a, b, h, and k for their partner.

At the end of class, I gave a requiz on transformations.  They were so much better.  This activity is definitely a keeper.  In addition, I may use the activity next year in my Algebra 2 class, as I had originally planned.

Year 13

MTBOSBlaugust2016

This week marked the beginning of my 13th year of teaching.

So many things this year are “new”.  I have a new principal and a new assistant principal for the first time in seven years.  I am teaching one section of a new course called Algebraic Reasoning.  I am using Canvas for the first time.  And I was invited to become a T3 Instructor earlier this month.

I am still teaching Pre-AP Algebra 2, but I specifically requested one section of Algebraic Reasoning so that I could try standard-based grading.  My Algebraic Reasoning class is small (19 students) and almost 50% are SPED.  It has been 9 years since I taught a class with a co-teacher, but I have a wonderful co-teacher that is going to help ensure that I am meeting the needs of all my students.

For the first time in my teaching career, I received a present from a current student on the first day of school.

Chocolate

Inside was a Ghirardelli Milk Chocolate Brownie bar.

Then on Tuesday, the following conversation occurred between a current student and myself.

S: Ms. Kelly, you are my third favorite teacher.

Me: Third favorite?!?  Who are your first and second favorite?

S: My color guard and choir directors.

I guess if extracurriculars are going to outweigh math, I’ll take being the third favorite.

I shake hands with my students as they come in the door, but that student had her hands full when she came to class on Wednesday.  She decided to give me a hug instead.

Finally, I had 35 students make a 95 or higher on their Unit 1 Prerequisite Skills test.  I haven’t looked to see how that number compares to previous years, but the star cut-outs that I put up are new.  I have had a star student wall since my first year teaching, but I bought a different set of stars this year.  I really like how they look on the bulletin board.

Stars

Badges and Bulletin Boards

MTBOSBlaugust2016

I was inspired by Sara Van Derwerf’s post about crazy math badges, so I created some for my department.

Math Department Badges

We have several bulletin boards in our math hall that have been bare pretty much since they were hung in the hall 1.5 years ago.  I saw Sara Van Derwerf’s post about her math wall of shame and knew that one of those bulletin boards was going to have something on it this year.  I printed a few of the photos she had available and posted them on one of the bulletin boards.

Wall of Shame

I thought if I was going to have a math wall of shame, I should also have a math wall of fame.  I found pictures of all the teachers in the math department and posted them on the bulletin board next to the wall of shame bulletin board.

Wall of Fame

Thank you Sara Van Derwerf for your inspiration.

There are still four more boards that do not have anything on them at the moment.  One of them will have our department’s tutoring times.  If you have suggestions for the other three, let me know.

Save

Save

Save

Save

Save

Save

Save

Save

Save

BreakoutEDU

About a month ago, I saw a tweet on Twitter referring to BreakoutEDU.  I opened the link to the blog post and was instantly intrigued.  The BreakoutEDU website was blocked by our school, so I had to use my cell phone to look at the site.  If you don’t sign up to be a beta tester, there isn’t much to see on the website other than an intro video and the supplies you would need to create your own breakout, if you don’t want to purchase their kit.  I signed up so that I could get the password to the games.  As soon as I had the chance, I went to my AP to share my enthusiasm with him regarding this new thing that I was going to try.
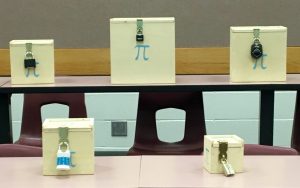
Boxes

Unlike the BreakoutEDU kit, I really wanted multiple boxes so that instead of having all clues out in the open, students would have to open a box to get a clue to another box, ultimately opening all the boxes and breaking out.  I also knew that I wanted the boxes to nest for easy storage.  I knew that I could get my dad to make these boxes for me.

I let my dad in on my idea, and he delivered.

One box  Nesting boxes  Stacked boxes

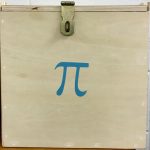
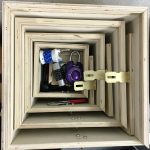
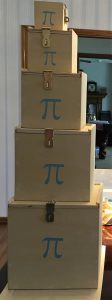
I now have four sets of breakout boxes, each with five nesting boxes.

Building Anticipation

I brought two set of boxes up to school one weekend and set them at the front of the room.  Then I started leaving messages in small print on the board.  I put up things like

  • Have you ever been to an escape room?
  • My stickers are missing.
  • I need a UV flashlight.
  • May 24

A few of the classes paid attention to these little notes and asked about them.

Some days I would change the lock that was on the outside of the box, or put the large hasp on the box with all the locks.

About a week before we were schedule to go play our game, I un-nested the two sets of boxes that were in my room.  The Saturday before we were schedule to go play our game, I brought up one more set of boxes.  Now I really had their attention.  Where were all these boxes coming from?
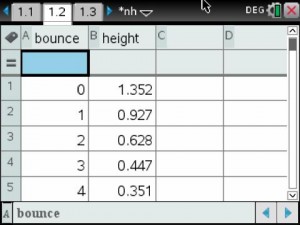
Games

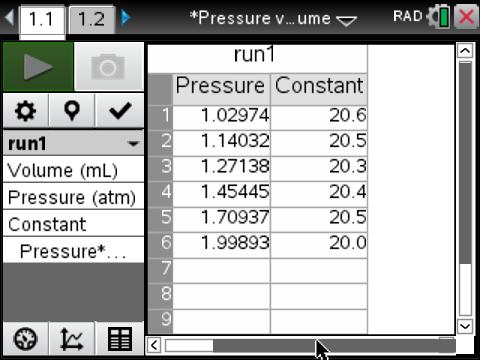
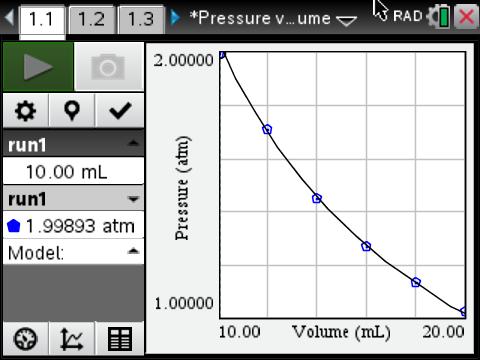
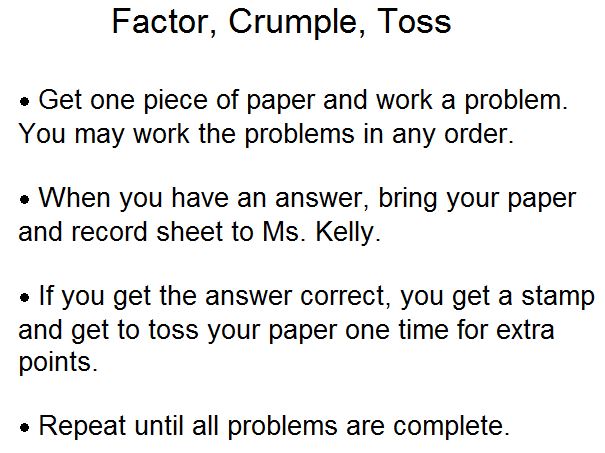
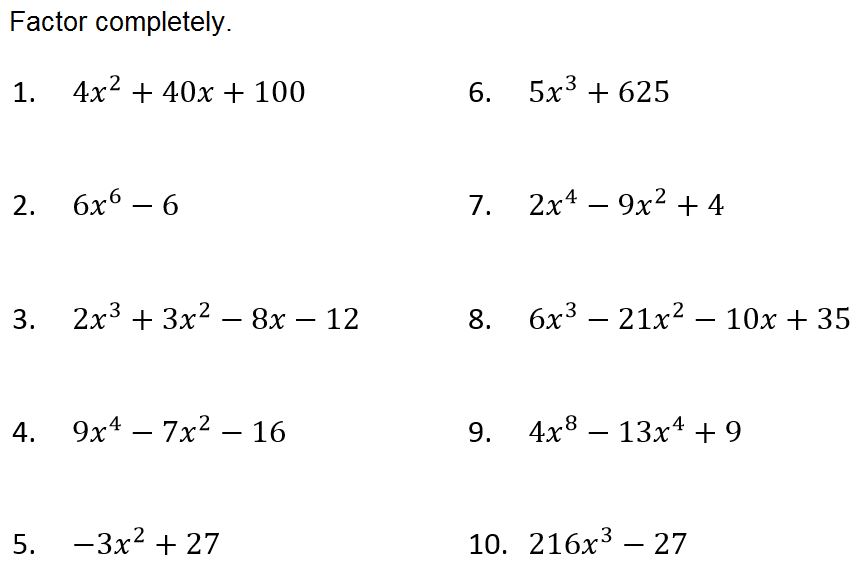
Since it is the end of the school year, I decided to create my own game for our first breakout.  I made a game that would review concepts for the spring semester exam.  The topics included transformations of parent functions, simplifying expressions (exponent rules and radicals), solving equations (radical and logarithmic), and rationals (properties of their graph, simplifying, and solving).  Students were given 45 minutes and two hint cards.

Review breakout

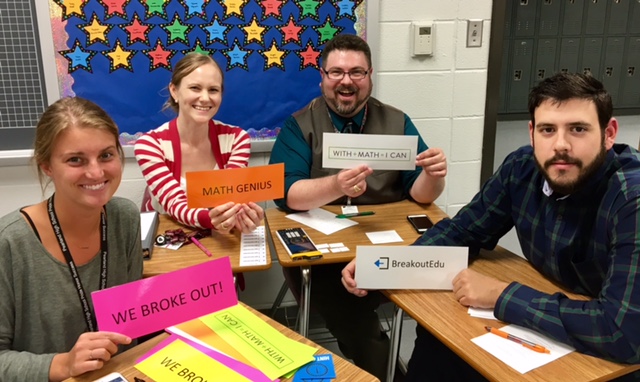
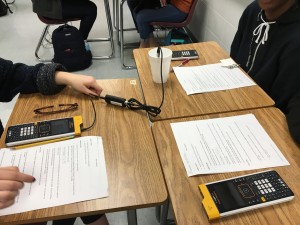
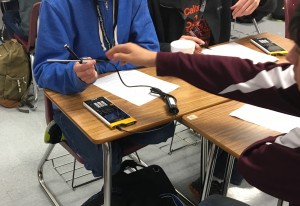
We went to the lecture hall to play our first game on May 24.  The classes were divided into three groups each.  I started the timer, and let them go.  Every group used one of their hint cards to get them started.


After they had the first box open, there was no stopping them.


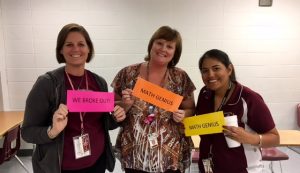
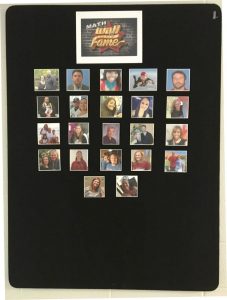
Every group, in every period, broke out!  Unfortunately, I didn’t get a video of any group opening their last box, but we did take pictures once they had opened their last box.  They also got a sticker for their success.  Believe it or not, high school students will do anything for a sticker.


The following day we did another breakout.  This time I used Dr. Johnson’s Lab from the BreakoutEDU website.  The setup only uses two boxes.  The big box has a hasp on it that can hold up to six locks.

Johnson setup

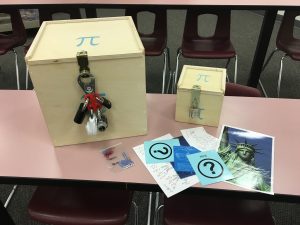
I only have two hasp, so we did boys versus girls.  I have mostly girls in all my classes, except for 5th period, which is pretty close to 50/50.  However, more heads did not lead to the girls breaking out faster than the boys.  Except for first period, the boys broke out before the girls.


Feedback from the students was that they really enjoyed the breakouts.

Data Collection – Exponential Part 2

Objectives

  • Record the successive maximum heights for a bouncing ball.
  • Model the bounce height data with an exponential function.

Procedure

Bounce Back

Groups of three students used a motion detector to collect the height of a bouncing ball for 5 seconds.

Ready to Bounce

Ready to Bounce

Bouncing Ball

Bouncing Ball

Analysis

An example of one group’s data collection.

Bounce Height Data Quest

Height vs Time Graph

Students determined the maximum height of five successive bounces.  They put the data in a List & Spreadsheets Page.

Bounce Height Data 1 Bounce Height Data 2

The data for the first and fourth bounce was used to mathematically determine an exponential model that would fit the data.  They plotted their data and model on a Data & Statistics Page.

Bounce Back Exponential

Calculated Model

Then they had the calculator find the exponential regression for their data.

Bounce Back Regression

Exponential Regression

Results

Most groups found their model and the exponential regression to be very similar.

Data Collection – Exponential

Today, as part of my Innovative Teaching Grant from the Pearland ISD Education Foundation, my students completed their third data collection lab.

Objectives

  • Record temperature versus time for a cooling object.
  • Model the temperature of an object as it cools.

Procedure

How Cool It Is

I had a crock pot of hot water.  Each group of three students were given a cup of the hot water.  They placed the temperature probe in the hot water for about 30 seconds, then removed the temperature probe and allowed it to cool.  The calculator collected the temperature data for three minutes.

probe in water

Temperature Probe in Hot Water

probe cooling

Temperature Probe Cooling

Analysis

An example of one group’s data collection.

Temp DataQuest before exp fit

Temperature vs Time Graph

Students determined that an exponential model should fit the data.  They had the calculator graph the exponential regression for their data.

Temp DataQuest

Temperature vs Time Graph with Exponential Regression

The exponential model did not appear to be a very good fit.  They determine that the exponential model should have an asymptote at room temperature.  So they adjusted the collected temperature values by subtracting the room temperature.  Then they sent the data to a Data & Statistics page for further analysis.

The data for 20 seconds and 160 seconds was used to mathematically determine an exponential model that would fit their adjusted temperature data.  They plotted their model, then compared their model to the exponential regression using the adjusted temperature data.

Temp with Plotted Function

Calculated Model

Temp with Regression

Exponential Regression

Results

Most groups found their model and the exponential regression to be very similar.

Data Collection – Inverse Variation

Objectives

  • Model pressure versus volume using inverse variation

Procedure

I had some extra time after reviewing for a test in one of my classes, so I got out the gas pressure sensor for us to model pressure versus volume. We had studied direct and inverse variation.

Since I only have two gas pressure sensors, we did this as a class demonstration using the TI-Navigator Live Presenter and one of the gas pressure sensors. One student had the calculator to capture the data and another student had the sensor with the syringe of air.

Most of my students are sophomores and are currently in Chemistry. They have not studied the gas laws, yet.  Before we started capturing the data, I had the student with the sensor increase and decrease the volume of air in the syringe. We looked at what was happening to the pressure and predicted that inverse variation would model the data.

Analysis

Pressure vs Volume Graph

Pressure vs Volume Graph

Pressure vs Volume Table

Pressure vs Volume Table

We looked at the table and saw that as the pressure increased, the volume decreased. We calculated the constant of variation by multiplying pressure and volume.

k Column

Constant of Variation Calculated Column

The constant of variation was relatively constant. The average was 20.4.

We plotted the inverse variation equation Inverse Variation Equation on our graph.

Pressure vs Volume Model

Inverse Variation Model

Factor, Crumple, Toss

Inspired by this post from Kate Nowak, today, we played Factor, Crumple, Toss.

I made a record sheet for each student.  The only thing they were to write on this paper was their name.  I also pre-cut several small sheets of paper for students to work the problems.  I explained the directions and answered any questions the students had.

Factor, Crumple, Toss Directions

Then I projected these problems.

Factor, Crumple, Toss Problems

Originally I had moved all the desks to the perimeter of the room and had the extra point tossing area in the middle of the room.  After 1st period, I made some changes to the room arrangement.  I moved the extra point tossing area so that is was next to a wall.  I did not want students walking through the tossing area while another student was trying to earn extra points.  I also put some tape on the floor where students were to form a line to have their answers checked.

Factor Crumple Toss

I loved the student’s engagement.  Not only were they working the problems, but they were encouraging each other as they attempted to get extra points.  Although some students became frustrated when they did not get the correct answer to a problem multiple times, I think the activity was much better than having the students sit at their desks and complete a worksheet.

Data Collection – Quadratic

On Friday, as part of my Innovative Teaching Grant from the Pearland ISD Education Foundation, my students completed their second data collection lab.

Objectives

  • Record height versus time data for a bouncing ball.
  • Model a single bounce using both the vertex and standard forms of a parabola.

Procedure

That’s the Way the Ball Bounces Instructions

Since my subject partner’s classes were not participating in the data collection, we had ten CBR2 to share among all students in the class.  With several students out for a pep rally, students were able to work with a partner, and each student collected his/her own data.  Students dropped a racquetball below the CBR2 motion detector.  The CBR2 collected data for position vs time for 5 seconds.

Ball Bounce

Analysis

An example of one student’s data collection.

Bounce Data

Positive vs Time Graph

Students chose one bounce to model.  They selected the bounce and struck the outside data.

One Bounce

One Bounce

Then they sent the data to a Data & Statistic page to analyze the bounce.

Scatterplot of One Bounce

Scatterplot of One Bounce

They traced along the scatterplot to find the coordinates of the vertex.  They used the coordinates of the vertex to plot a function in vertex form.  Students had to change the value of a until they found the best fit for their data.

Scatterplot Vertex Form

Vertex Form

Then they expanded the vertex form to get the equation in standard form.  This student’s equation was Vertex to Standard Form.

Next they had the calculator find the quadratic regression for their bounce.

Scatterplot Regression

Quadratic Regression

Students compared the expanded vertex form equation to the standard form from the regression.  They found that the vertex form equation they had plotted was very similar to the standard form equation from the regression.

Students answered the questions on the record sheet.

That’s the Way the Ball Bounces Record Sheet

Conclusion

More than one student commented, “That was fun.”

Some of the juniors mentioned that they wished the had the TI-Nspire in Physics class.  They had recently done an experiment using the TI-84s with the motion detector to see how long it takes objects of differing masses to hit the ground.  They commented that it was easier to use the motion detector with the TI-Nspire.