Today, as part of my Innovative Teaching Grant from the Pearland ISD Education Foundation, my students completed their third data collection lab.
Objectives
- Record temperature versus time for a cooling object.
- Model the temperature of an object as it cools.
Procedure
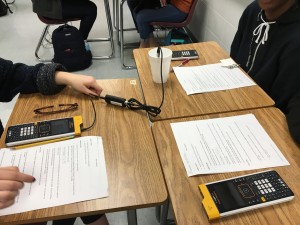
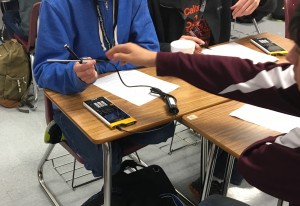
I had a crock pot of hot water. Each group of three students were given a cup of the hot water. They placed the temperature probe in the hot water for about 30 seconds, then removed the temperature probe and allowed it to cool. The calculator collected the temperature data for three minutes.
Temperature Probe in Hot Water
Temperature Probe Cooling
Analysis
An example of one group’s data collection.
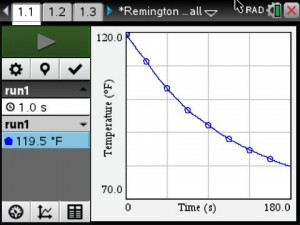
Temperature vs Time Graph
Students determined that an exponential model should fit the data. They had the calculator graph the exponential regression for their data.
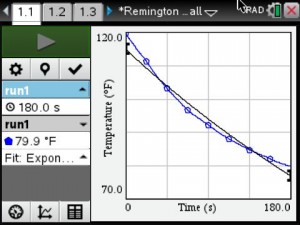
Temperature vs Time Graph with Exponential Regression
The exponential model did not appear to be a very good fit. They determine that the exponential model should have an asymptote at room temperature. So they adjusted the collected temperature values by subtracting the room temperature. Then they sent the data to a Data & Statistics page for further analysis.
The data for 20 seconds and 160 seconds was used to mathematically determine an exponential model that would fit their adjusted temperature data. They plotted their model, then compared their model to the exponential regression using the adjusted temperature data.
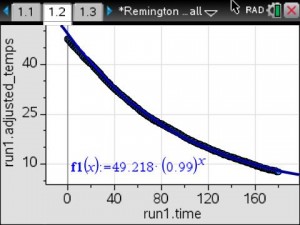
Calculated Model
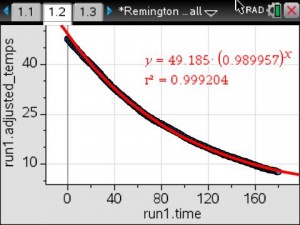
Exponential Regression
Results
Most groups found their model and the exponential regression to be very similar.