Yesterday, as part of my Innovative Teaching Grant from the Pearland ISD Education Foundation, my students completed a data collection lab.
Objective
- Model pressure versus volume using inverse variation
Procedure
Although students were in groups of three to four, each student collected their own data. Members of the group rotated between three jobs: syringe, calculator, directions.
A syringe containing 15 mL of air was screwed onto the gas pressure sensor, which was connected to the TI-Nspire. The pressure of the air was recorded using the Data Quest App on the TI-Nspire.
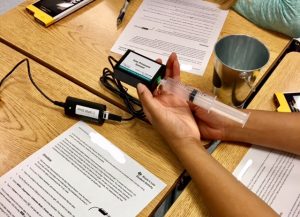
Gas Pressure Sensor with Syringe
The gas was compressed to 14 mL, and the pressure was recorded.
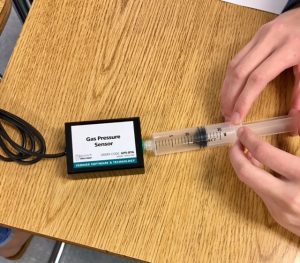
Compressing the Air in the Syringe
The pressure reading was also recorded for 13 mL, 12 mL, 11 mL, and 10 mL.
Analysis
An example of one student’s data collection.
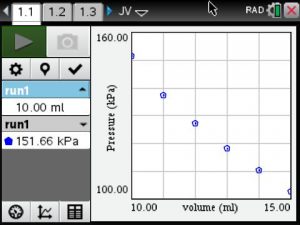
Pressure vs Volume Graph
Students noted that as the volume increased the pressure decreased.
The constant of variation was calculated by multiplying pressure and volume. Then the average was calculated.
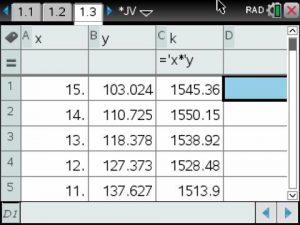
Data Table
Using the mean value for the constant of variation, a model was written and graphed on the scatterplot of the data.
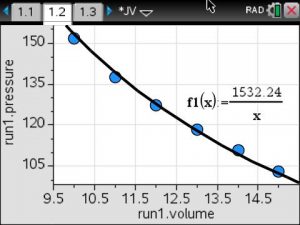
Inverse Variation Model
Results
Students used their models to predict the pressure for a volume of 20 mL and 5 mL. Based on their predictions, they were able to determine that when the volume of a gas is decreased from 40 mL to 10 mL, the pressure will quadruple.